How fast EVs really charge
Real-world EV charging speeds.
Charging speeds and curves from real charges by PlugLog drivers, by make and model, and by the weather. Not the spec sheet's peak: what the car actually took, all the way through the charge.
Shared by PlugLog drivers
- charges
- 352
- charges
- EV models
- 19
- EV models
- kWh added
- 11,675
- kWh added
Every number comes from a real charge, measured by the car itself, and grows as more drivers share.
Updated · from 352 shared charges
- Every make
- Cadillac
- Chevrolet
- GMC
- Honda
- Polestar
- Tesla
- Every GMC
- Sierra EV
- Sierra EV AT4 / Denali (Extended Range)
Showing GMC
Charging curve: GMC
How fast it charges at each battery level, from 6 DC fast charges: about the best seen at each level, so a slower charger doesn't drag it down.
Up to 319 kW
DC fast charging by outside temperature
A cold battery takes charge slower. Each charge's average speed, typical for the temperature it started in.
- 68–86°F188 kW average6 charges
- Above 86°F257 kW average1 charge
Longer bars charge faster.
By vehicle
Every year of a model together. Tap one for its own page: its charging curve, where it charged, and more. DCFC 10–80%: estimated from its charging curve and battery, at a charger as fast as the car; the distance at its real-world efficiency.
- GMC Sierra EV2025
- DC fast charges
- 7
- Peak
- 288 kWbest 335
- Average
- 216 kW
- DCFC 10–80%
- ≈ 39 min (269 mi)
- Avg DCFC time
- 27m
- Level 2
- 12 charges8.7 kW average
- GMC Sierra EV AT4 / Denali (Extended Range)2026
- DC fast charges
- —
- Level 2
- 15 charges10.7 kW average
Only charges from drivers who chose to share their efficiency and charging data, with no names, places or times. DC fast is a charge that averaged 20 kW or more (faster than Level 2 can go). How it's measured
Chargers that work
The most reliable chargers
Public chargers where PlugLog drivers' charges worked, ranked by how sure that is: a charger that worked 19 of 20 times ranks above one that worked 3 of 3. From their charges and ratings in the last 90 days.
Not enough ratings yet.
A charger shows here once 2 drivers have charged or checked in there, 3 times or more.
How it's measured
Real charges, straight from the car.
Spec sheets give a peak. These come from the plug: every charge shared by a PlugLog driver, recorded by the car itself.
From the car itself
The PlugLog car app records the charging power and battery level many times a minute, from the car's own readings, for every charge.
Shared on purpose
Charges count only if their driver shares their efficiency and charging data, and then all of them do. No names, no places, no times: just how the EV charged.
Every charger
Fast and slow chargers, hot days and cold ones. The curve keeps about the best seen at each battery level, so it shows what the car can do.
Track your own EV
Get numbers like these for your car.
PlugLog logs every drive and charge, works out what your EV really gets, and lets you share it to help the next buyer.
- Free
- Android Automotive car app
- Share only what you choose
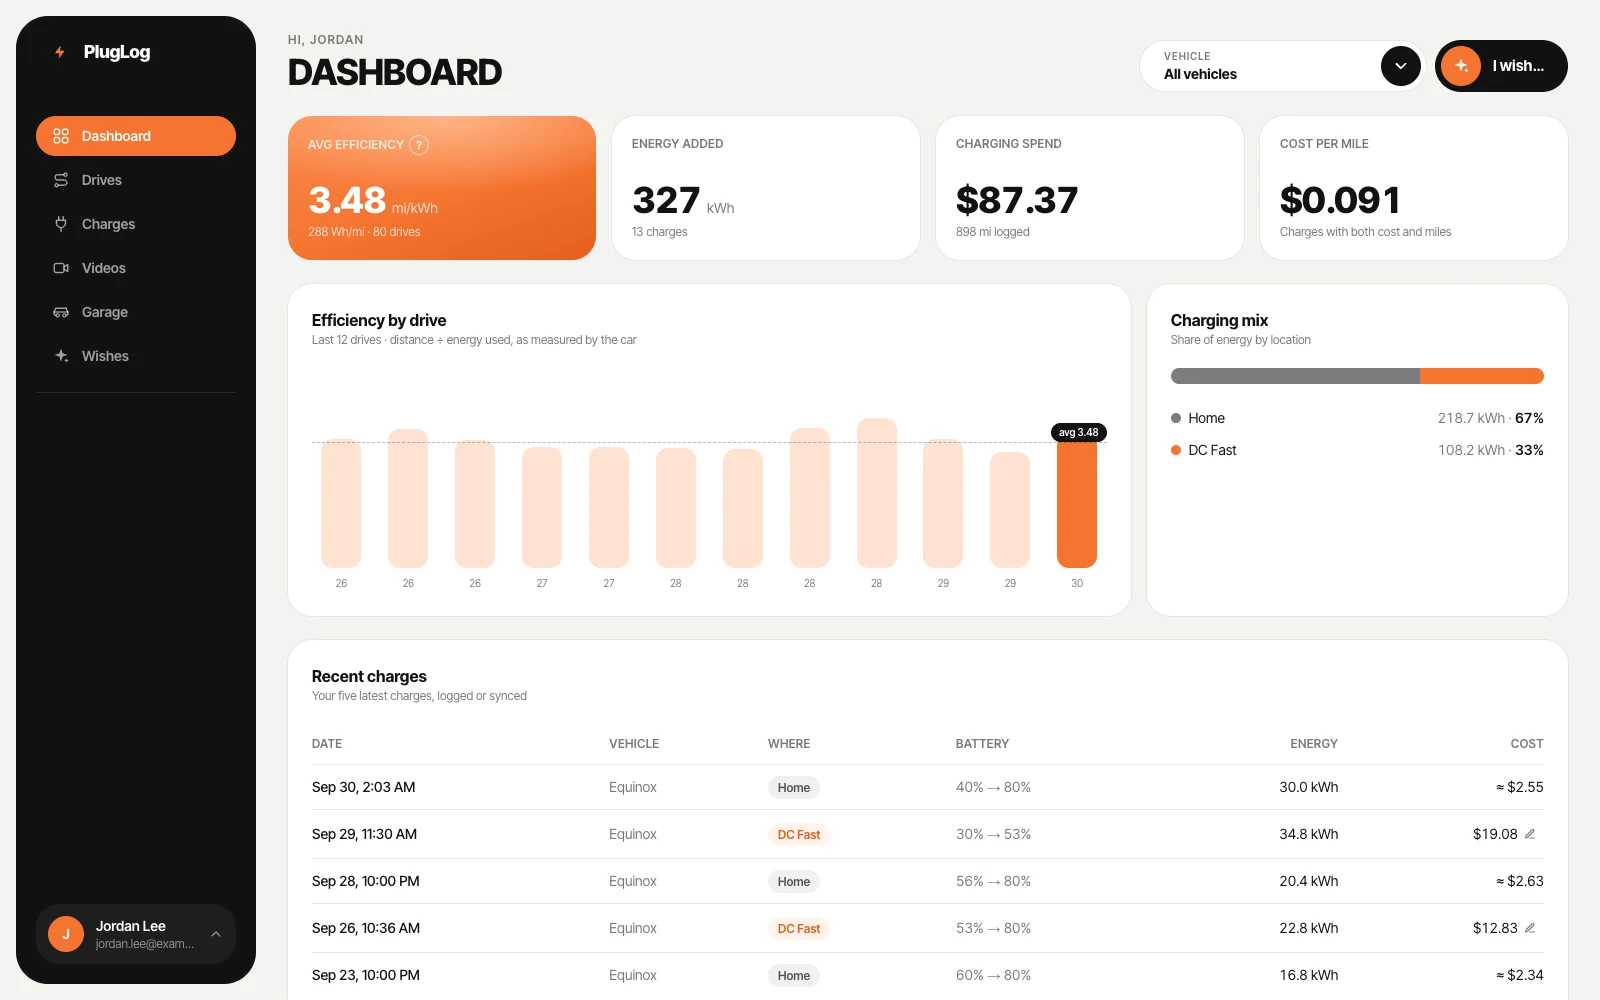
Your EV's dashboard
Your own efficiency, energy added, charging spend and cost per mile, drive by drive.
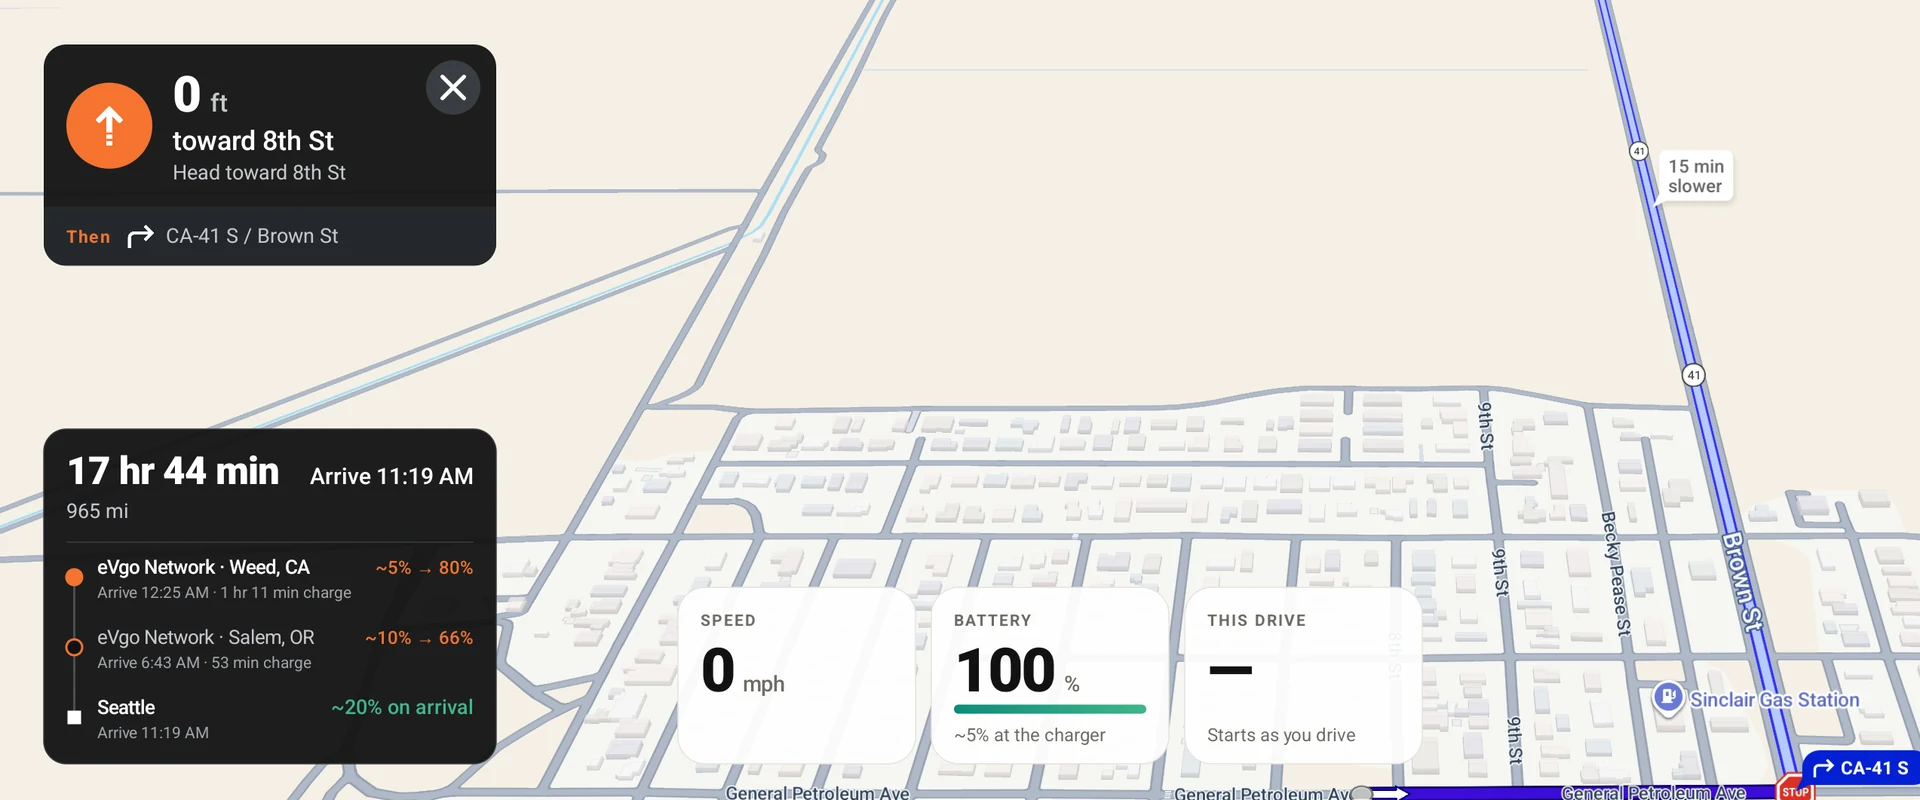
Live in your car
On Android Automotive, PlugLog navigates, plans your charging stops, and records every drive and charge on its own, with this drive's efficiency on the map.
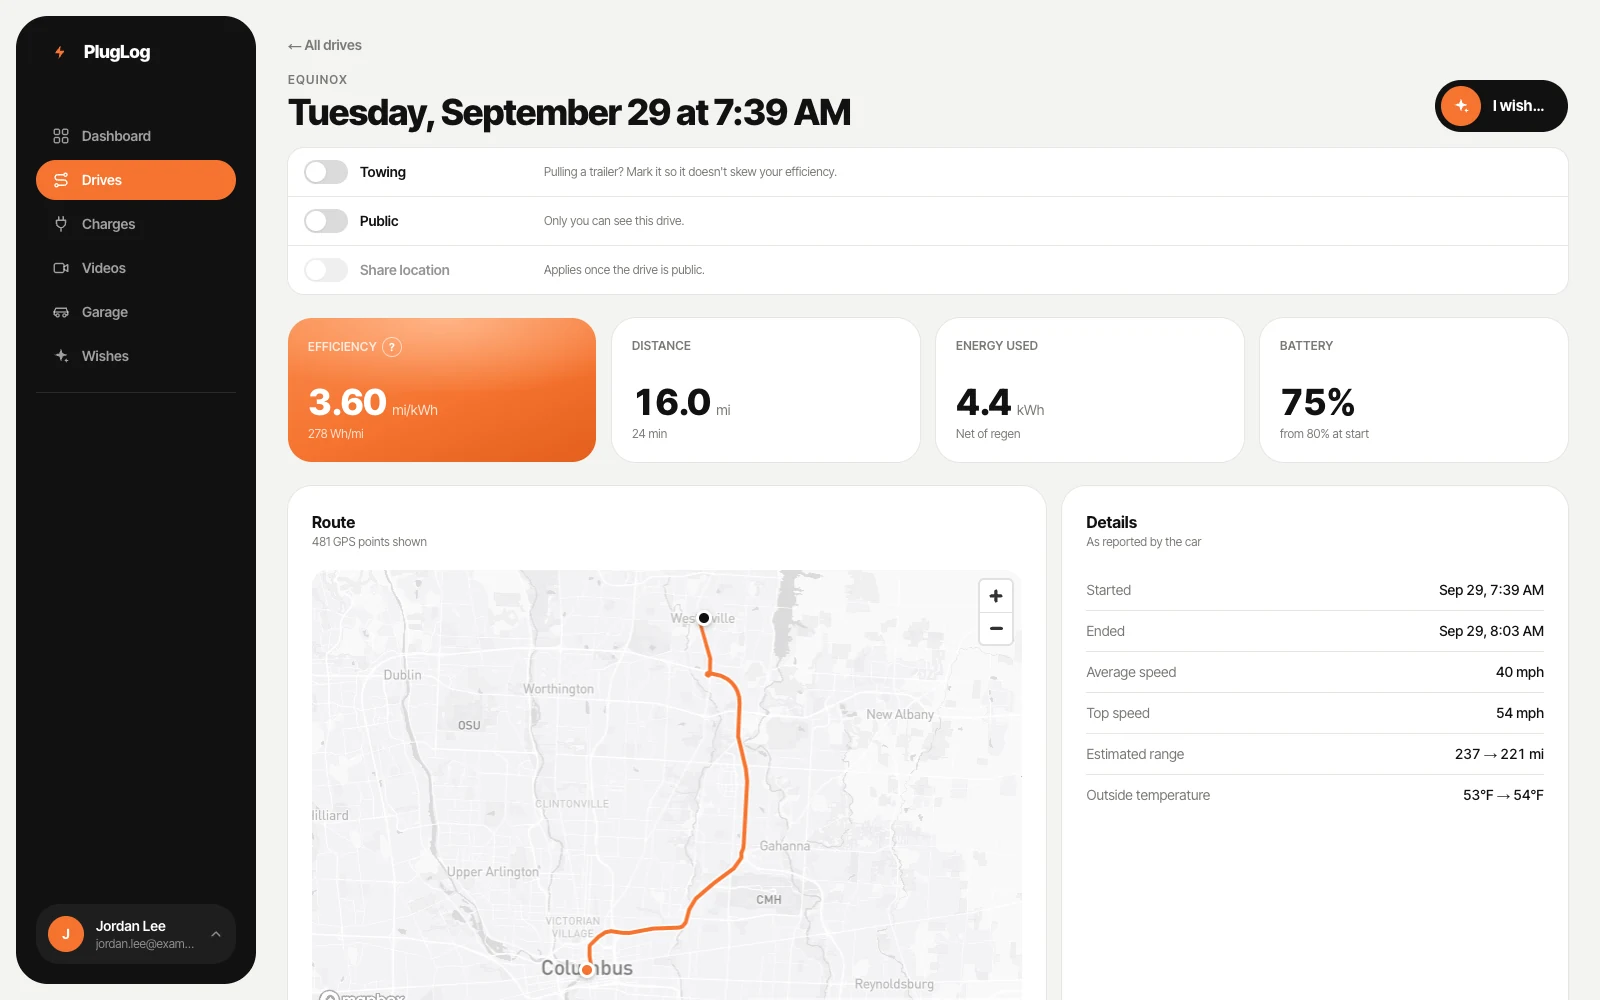
Every drive, second by second
Where the energy went, driving, regen and stopped, with the route, speed and battery level.
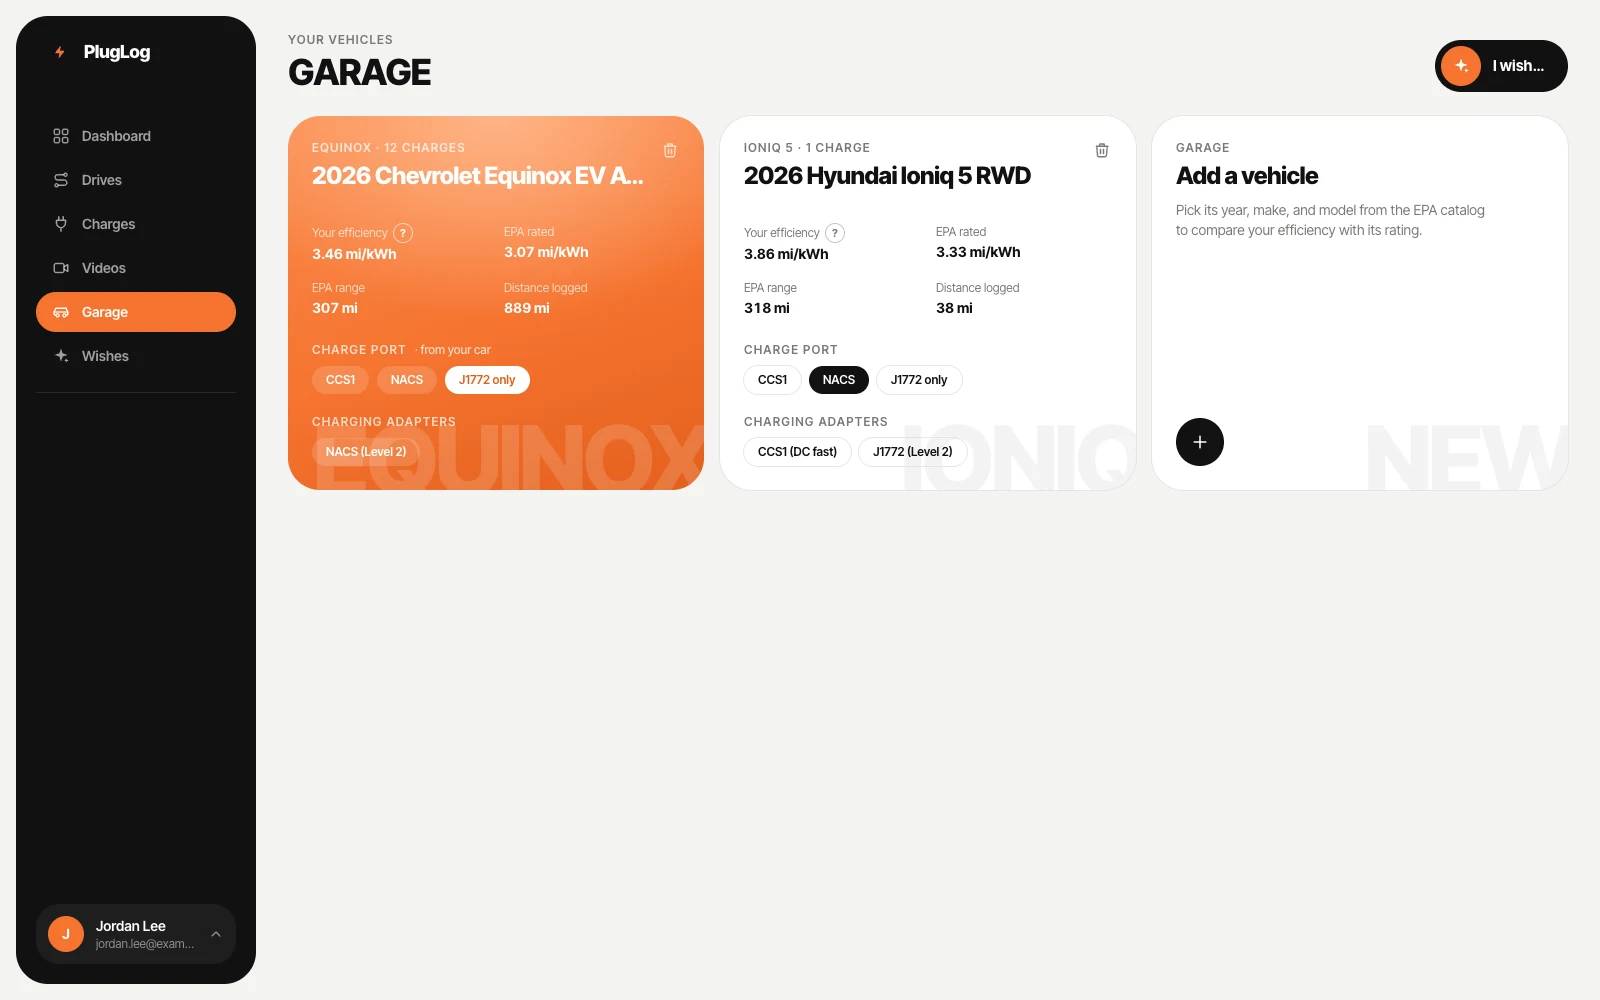
You vs the EPA rating
See how your EV compares with its rating, and share your drives to add to the numbers above.
Your EV belongs on this page.