Monthly report · October 2026
What EVs really did in October 2026.
Real drives, charges and prices from PlugLog drivers, Oct 1, 2026–Oct 31, 2026. Published Nov 2, 2026.
In October 2026, PlugLog drivers' EVs averaged 2.60 mi/kWh over 2,356 drives. Drives below 50°F went 5% less far per kWh than the same EVs' warm ones. DC fast charging peaked at 159 kW on a typical charge, with stops averaging 29 minutes. Drivers paid $0.41/kWh at US DC fast chargers; ChargePoint was the cheapest, at $0.32 across 5 charges.
Efficiency
EV efficiency in October 2026
PlugLog drivers logged 2,356 drives and 32,194 miles in October 2026, in 24 different EV models and trims, using 12,394 kWh from their batteries. That's 2.60 miles for every kWh on average, or 385 Wh a mile.
By model
Most efficient EVs of October 2026
The Chevrolet Equinox EV was the most efficient model with enough drives in October, at 3.65 mi/kWh over 147 drives. At the other end, the Chevrolet Silverado EV averaged 2.14 mi/kWh, 41% less far per kWh than the Chevrolet Equinox EV. Each model is every year and trim of it together, from at least 2 drivers and 20 drives.
- Drives
- 147
- Miles
- 2,317
- mi/kWh
- 3.65
- Drives
- 364
- Miles
- 4,899
- mi/kWh
- 3.62
- Drives
- 191
- Miles
- 1,608
- mi/kWh
- 3.51
- Drives
- 172
- Miles
- 1,725
- mi/kWh
- 3.11
- Drives
- 146
- Miles
- 1,840
- mi/kWh
- 3.04
- Drives
- 340
- Miles
- 4,589
- mi/kWh
- 2.26
- Drives
- 776
- Miles
- 12,961
- mi/kWh
- 2.14
| Model | Drives | Miles | mi/kWh |
|---|---|---|---|
| Chevrolet Equinox EV | 147 | 2,317 | 3.65 |
| Tesla Model Y Performance AWD | 364 | 4,899 | 3.62 |
| Cadillac LYRIQ | 191 | 1,608 | 3.51 |
| Polestar 4 Long Range | 172 | 1,725 | 3.11 |
| Polestar 2 | 146 | 1,840 | 3.04 |
| GMC Sierra EV | 340 | 4,589 | 2.26 |
| Chevrolet Silverado EV | 776 | 12,961 | 2.14 |
Weather
EV efficiency in cold weather, October 2026
On drives that started at 32–50°F, EVs went 4% less far per kWh than the same EVs did at 68–86°F. Warm-weather drives (68–86°F) averaged 2.70 mi/kWh across 831 drives. Hot days cost range too: drives above 86°F went 3% less far, from air conditioning and battery cooling. Cold batteries and cabin heat both cost range; preconditioning while plugged in takes some of that off the battery.
- 32–50°F
- Drives
- 252
- mi/kWh
- 2.33
- vs 68–86°F, same EVs
- −4%
- 50–68°F
- Drives
- 1,076
- mi/kWh
- 2.62
- vs 68–86°F, same EVs
- +1%
- 68–86°F
- Drives
- 831
- mi/kWh
- 2.70
- vs 68–86°F, same EVs
- Base
- Above 86°F
- Drives
- 184
- mi/kWh
- 2.45
- vs 68–86°F, same EVs
- −3%
| Outside temperature | Drives | mi/kWh | vs 68–86°F, same EVs |
|---|---|---|---|
| 32–50°F | 252 | 2.33 | −4% |
| 50–68°F | 1,076 | 2.62 | +1% |
| 68–86°F | 831 | 2.70 | Base |
| Above 86°F | 184 | 2.45 | −3% |
Speed
Highway vs city EV efficiency, October 2026
Town driving (an average of 20–40 mph) got 2.94 mi/kWh over 1,492 drives in October. Drives averaging 55–70 mph went 19% less far per kWh than the same EVs in town: air resistance grows with the square of speed. The slowest drives (under 20 mph on average) went 11% less far too: short, stop-and-go trips spend more of their energy on heat and the car's own systems. Speed bands are by a drive's average speed, stops and all, so a highway trip with a slow start counts as its average.
- Under 20 mph
- Drives
- 411
- mi/kWh
- 2.67
- vs 20–40 mph, same EVs
- −11%
- 20–40 mph
- Drives
- 1,492
- mi/kWh
- 2.94
- vs 20–40 mph, same EVs
- Base
- 40–55 mph
- Drives
- 334
- mi/kWh
- 2.66
- vs 20–40 mph, same EVs
- −9%
- 55–70 mph
- Drives
- 107
- mi/kWh
- 2.35
- vs 20–40 mph, same EVs
- −19%
| Average speed | Drives | mi/kWh | vs 20–40 mph, same EVs |
|---|---|---|---|
| Under 20 mph | 411 | 2.67 | −11% |
| 20–40 mph | 1,492 | 2.94 | Base |
| 40–55 mph | 334 | 2.66 | −9% |
| 55–70 mph | 107 | 2.35 | −19% |
Charging
EV charging in October 2026: home vs DC fast
Of 500 charges in October, 77% were at home, work or other Level 2 chargers, and 23% were DC fast. DC fast charging supplied 39% of the 15,678 kWh added. A typical DC fast stop peaked at 159 kW and added 42 points of battery (46 kWh), with stops averaging 29 minutes.
Charging speed
Fastest-charging EVs of October 2026
The GMC Sierra EV charged fastest in October, averaging 159 kW over a whole DC fast charge and peaking at 177 kW on a typical one. The average over a whole charge is what decides how long a stop takes: a high peak that drops off early adds less than a lower, flatter curve.
- GMC Sierra EV
- DC fast charges
- 9
- Average
- 159 kW
- Typical peak
- 177 kW
- Battery added
- 46%
- Time
- 27m
- Chevrolet Silverado EV
- DC fast charges
- 56
- Average
- 146 kW
- Typical peak
- 200 kW
- Battery added
- 36%
- Time
- 30m
- Tesla Model Y Performance AWD
- DC fast charges
- 21
- Average
- 117 kW
- Typical peak
- 192 kW
- Battery added
- 38%
- Time
- 18m
- Polestar 4 Long Range
- DC fast charges
- 9
- Average
- 87 kW
- Typical peak
- 119 kW
- Battery added
- 56%
- Time
- 35m
| Model | DC fast charges | Average | Typical peak | Battery added | Time |
|---|---|---|---|---|---|
| GMC Sierra EV | 9 | 159 kW | 177 kW | 46% | 27m |
| Chevrolet Silverado EV | 56 | 146 kW | 200 kW | 36% | 30m |
| Tesla Model Y Performance AWD | 21 | 117 kW | 192 kW | 38% | 18m |
| Polestar 4 Long Range | 9 | 87 kW | 119 kW | 56% | 35m |
Prices
EV charging prices, October 2026
US DC fast charging cost PlugLog drivers $0.41 per kWh on average in October, across 32 priced charges, tax and fees in. ChargePoint was the cheapest network, at $0.32 across 5 charges.
- Charges
- 5
- Average per kWh
- $0.32
- Charges
- 2
- Average per kWh
- $0.39
- Charges
- 1
- Average per kWh
- $0.40
- Charges
- 21
- Average per kWh
- $0.42
- Charges
- 3
- Average per kWh
- $0.51
| US DC fast network | Charges | Average per kWh |
|---|---|---|
| ChargePoint | 5 | $0.32 |
| IONNA | 2 | $0.39 |
| Rivian Adventure Network | 1 | $0.40 |
| Tesla Supercharger | 21 | $0.42 |
| Electrify America | 3 | $0.51 |
Cheapest first. Networks with only a few charges are weighted toward the month's average when ranked; each shows its own average.
A change is only called from enough charges in both months, network for network, as the charging prices page counts it. Add what your charges cost in PlugLog to help.
Savings
Gas and CO₂ saved by EVs in October 2026
In gas cars like them, October 2026's 32,194 miles would have burned about 1,687 gallons, or $7,270 at that month's US average of $4.31 a gallon. Charged at home at the US average of 18¢ per kWh, the same miles cost about $2,501. They put out about 21,715 lb less CO₂ than those gas cars would have, 66% less, counting the US grid's average emissions for every kWh.
Questions
- What was the average EV efficiency in October 2026?
- 2.60 miles per kWh, over 2,356 drives and 32,194 miles by PlugLog drivers in 24 EV models and trims, measured from each car's own battery.
- Which EV was the most efficient in October 2026?
- The Chevrolet Equinox EV, at 3.65 mi/kWh over 147 drives, among models with at least 20 drives from 2 or more drivers.
- How much range did EVs lose in cold weather in October 2026?
- Drives that started at 32–50°F went 4% less far per kWh than the same EVs' drives at 68–86°F.
- How much did highway driving cut EV range in October 2026?
- Drives averaging 55–70 mph went 19% less far per kWh than the same EVs in town (20–40 mph).
- How fast was DC fast charging in October 2026?
- A typical DC fast charge peaked at 159 kW and averaged 120 kW over the whole charge, across 115 DC fast charges.
- How much did DC fast charging cost in October 2026?
- $0.41 per kWh on average at US DC fast chargers, tax and fees in, across 32 charges. The cheapest network was ChargePoint, at $0.32 across 5 charges.
- How much gas did EVs save in October 2026?
- About 1,687 gallons ($7,270) and 21,715 lb of CO₂, against gas cars like them driving the same 32,194 miles.
How we measure
Every number comes from drives and charges PlugLog drivers' cars recorded in October 2026 (UTC), read from each car's own battery: miles driven over the energy the battery gave, not the EPA's lab figures. Towing drives, implausible readings and review accounts are left out.
A model, temperature or speed row needs at least 20 drives from 2 or more drivers, and a charging model 5 DC fast charges from 2 drivers, so no row is one person's. Comparisons marked "same EVs" set each EV against its own drives, so a band with more pickups doesn't read as worse weather. Every network with a US DC fast price that month is listed, ranked with its price pulled toward the month's average by 5 charges' worth, so a network with only a few cheap charges can't come out cheapest on luck; each shows its own real average and how many charges it's from.
Prices are what drivers paid per kWh billed, tax and fees in, at public chargers only: never a charge at a driver's home or other saved places. Gas savings set each EV against a gas car of the same make or class (its EPA combined mpg) at that month's US average gas price (EIA), and count CO₂ from the US grid's average for every kWh, charging losses in. Nothing here names a driver, a car or a place.
Share or embed this report
The image never changes: it's October 2026's numbers, for good. Free to use with a link back.
For a web page or blog.
Every number from PlugLog drivers who share their data, with how many drives, charges or prices it's from, worked out as on the efficiency, charging and prices pages. Its numbers are as they were when it was published.
Track your own EV
Get numbers like these for your car.
PlugLog logs every drive and charge, works out what your EV really gets, and lets you share it to help the next buyer.
- Free
- Android Automotive car app
- Share only what you choose
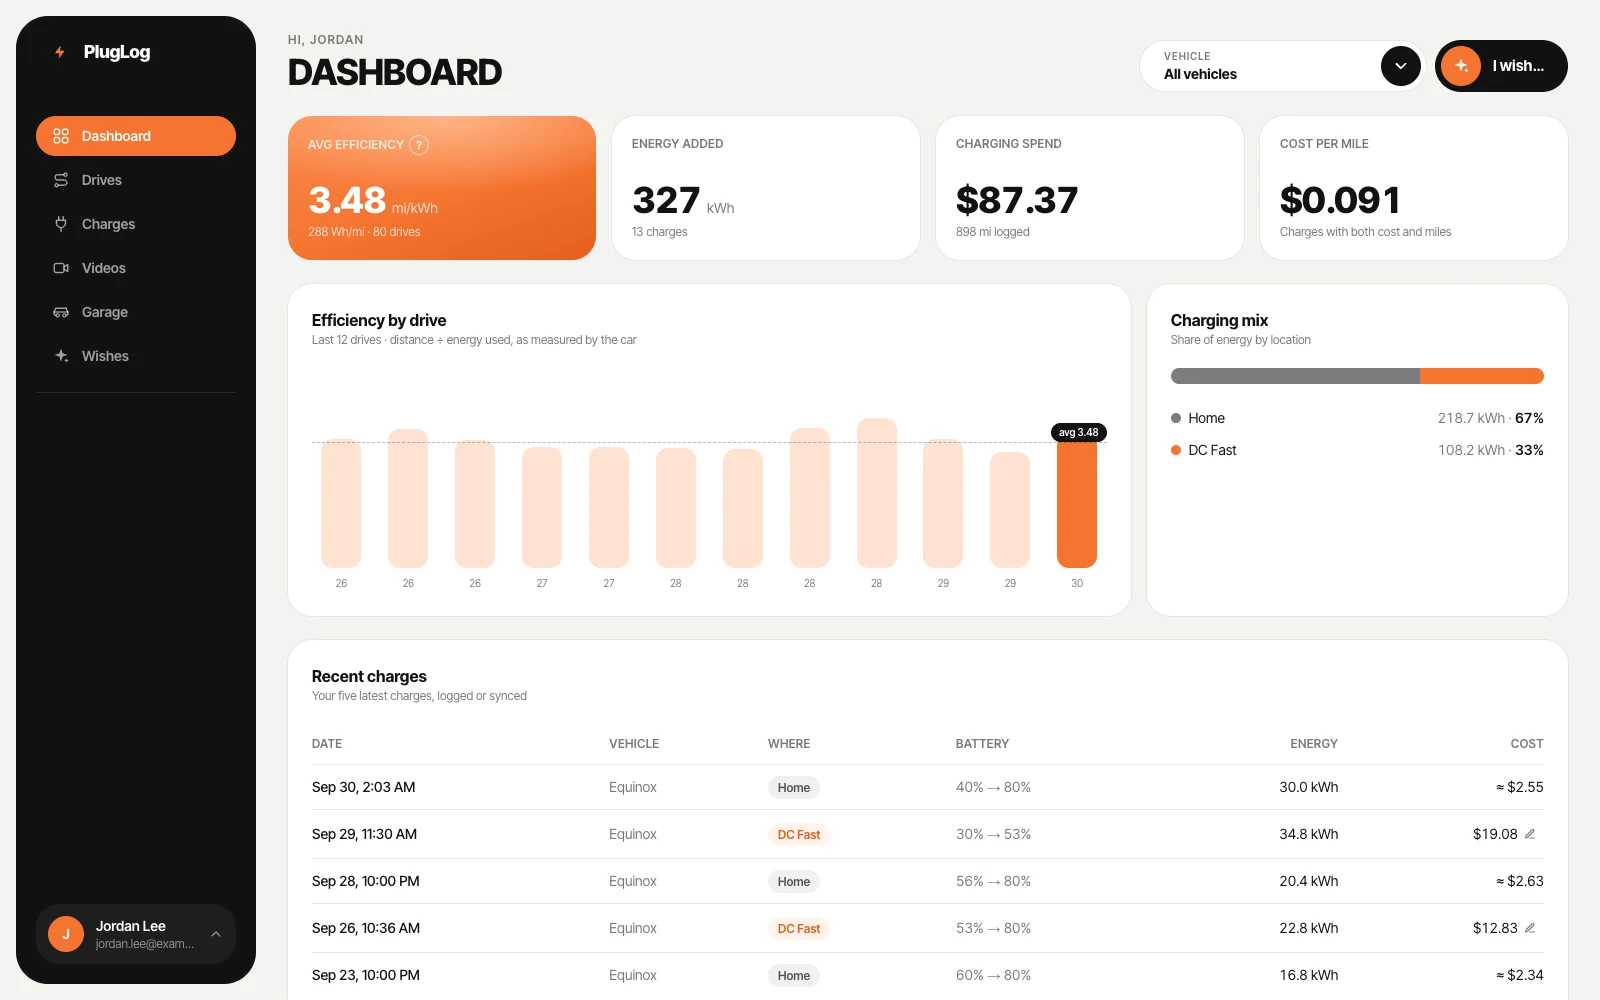
Your EV's dashboard
Your own efficiency, energy added, charging spend and cost per mile, drive by drive.
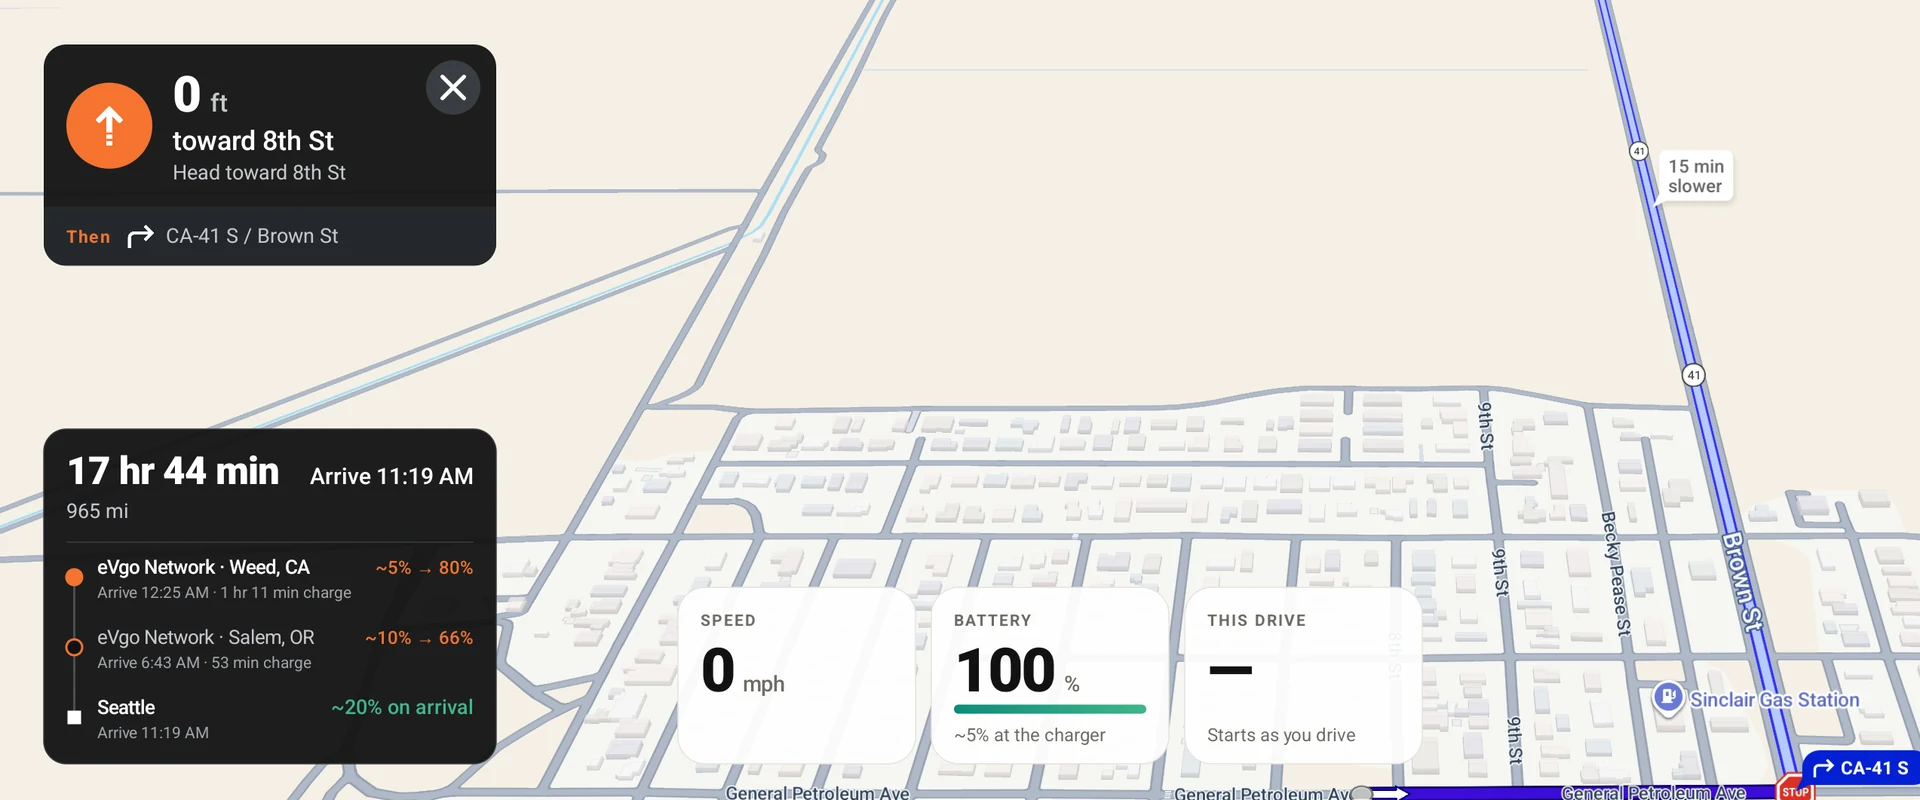
Live in your car
On Android Automotive, PlugLog navigates, plans your charging stops, and records every drive and charge on its own, with this drive's efficiency on the map.
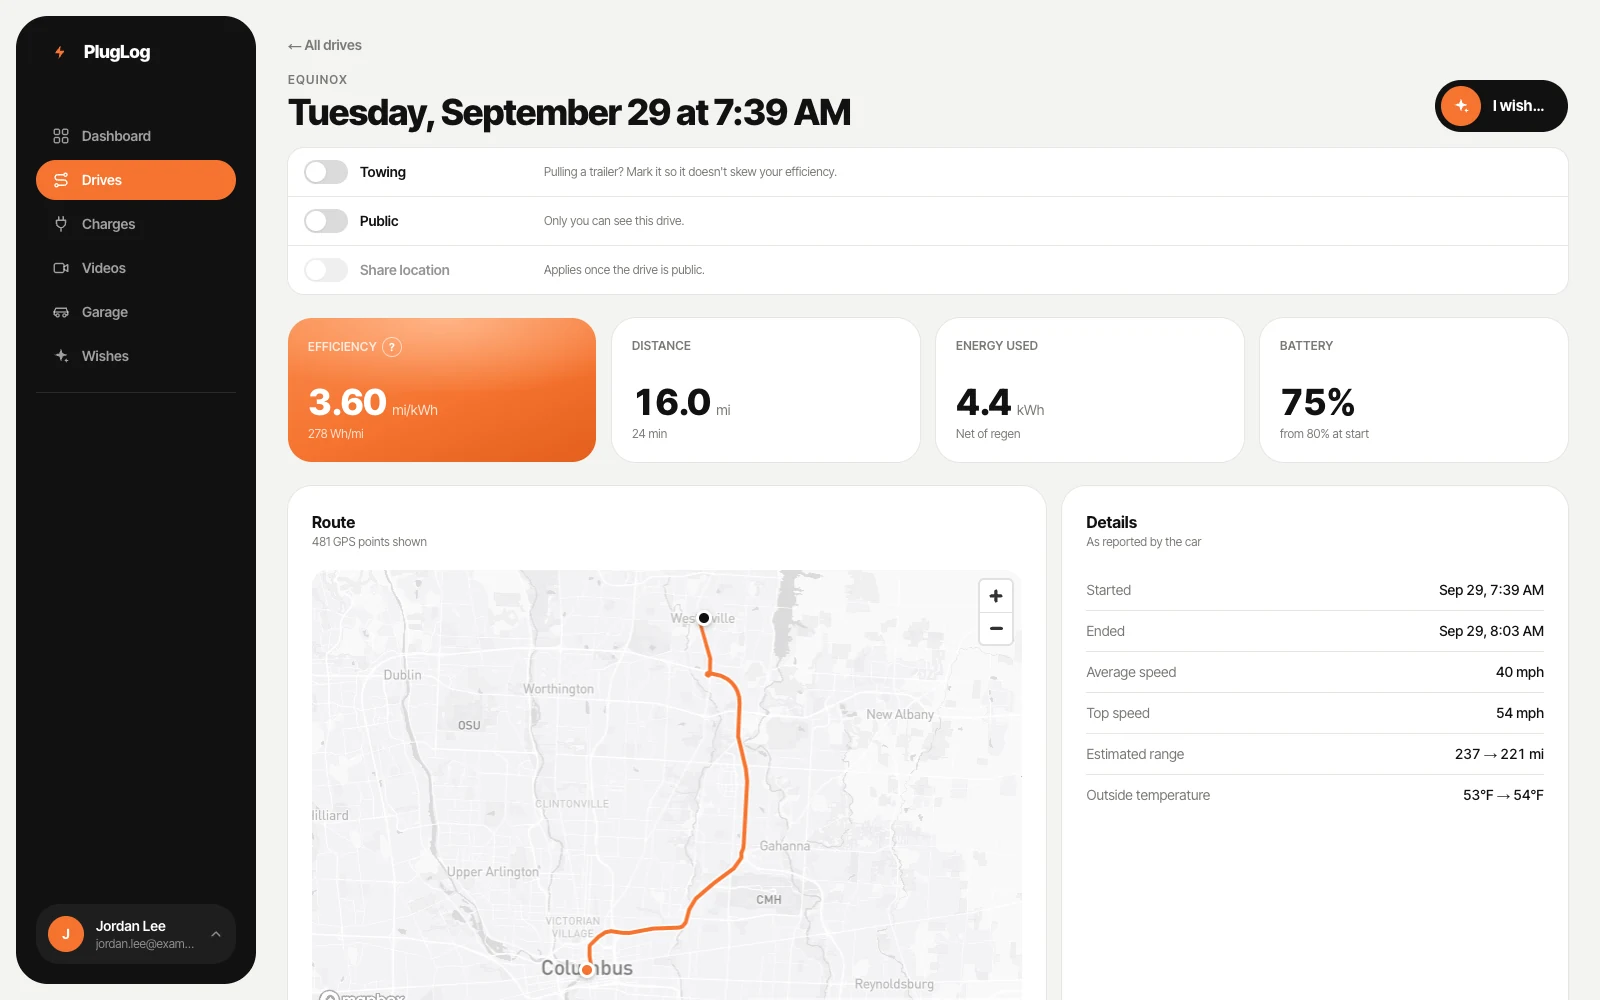
Every drive, second by second
Where the energy went, driving, regen and stopped, with the route, speed and battery level.
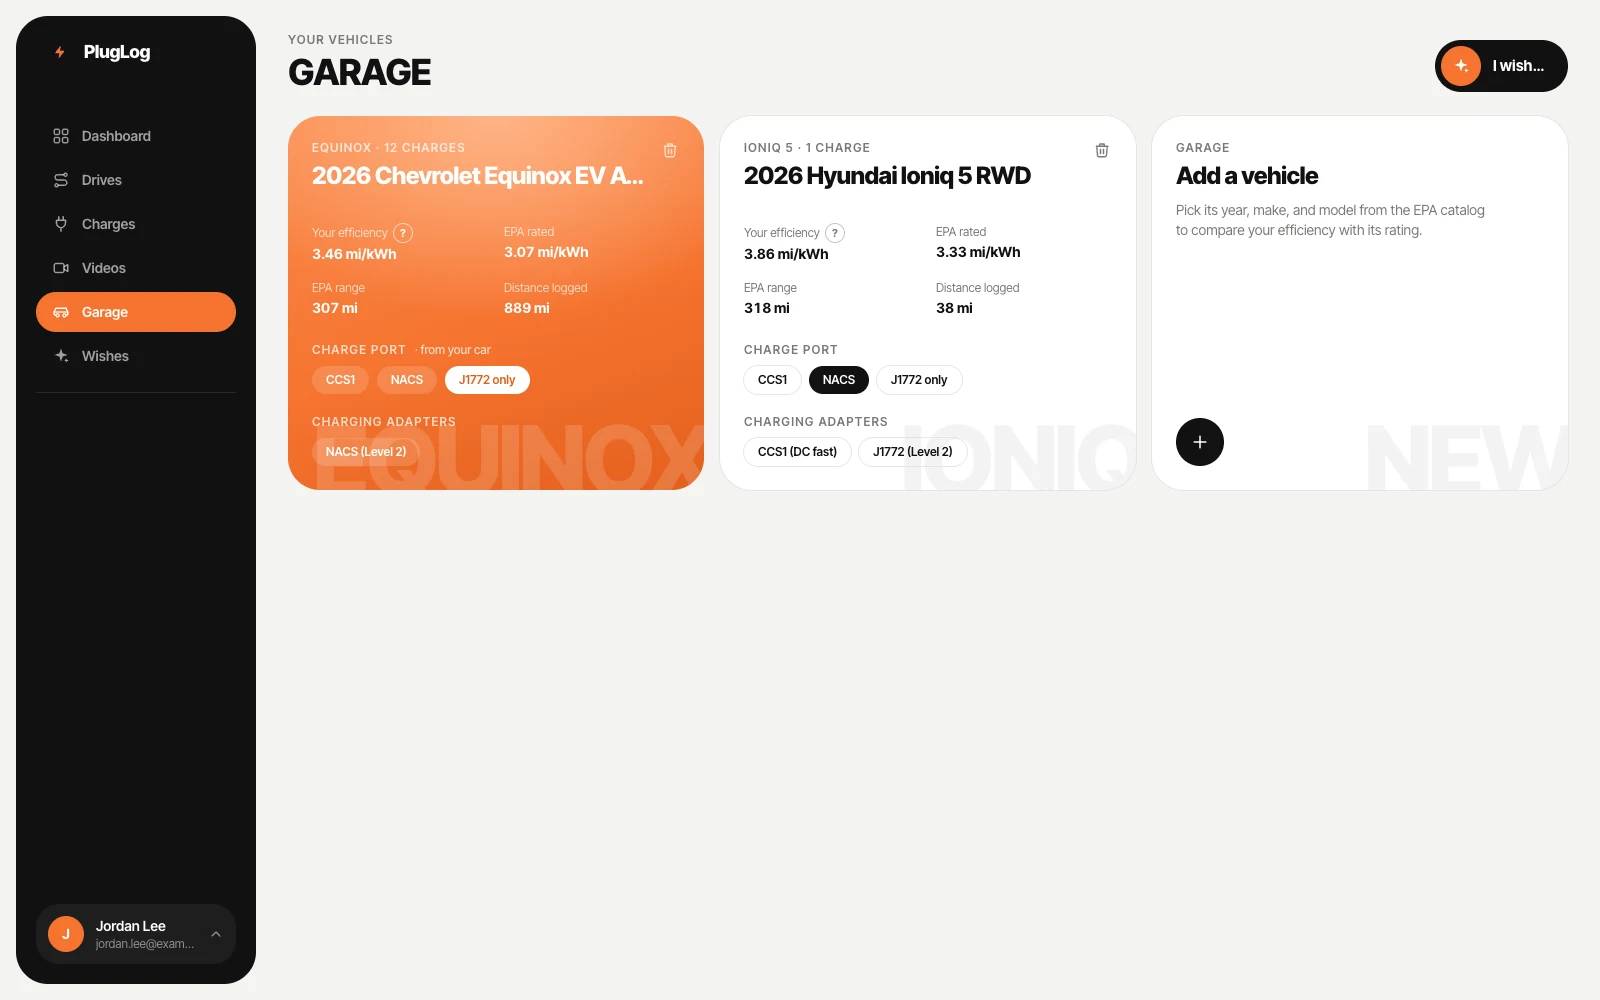
You vs the EPA rating
See how your EV compares with its rating, and share your drives to add to the numbers above.
Your EV belongs on this page.